Using data from the Federal Reserve, the assets and liabilities of US banks have been visualized below.
The U.S. banking sector has more than 4,000 FDIC-insured banks that play a crucial role in the country’s economy by securely storing deposits and providing credit in the form of loans.
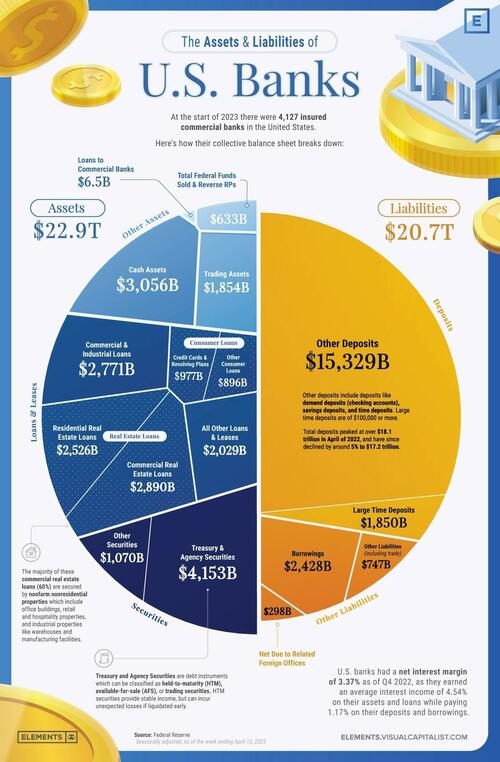
This infographic from Visual Capitalist’s Niccolo Conte and Christina Kostandi visualizes all of the deposits, loans, and other assets and liabilities that make up the collective balance sheet of U.S banks using data from the Federal Reserve.
With the spotlight on the banking sector after the collapses of Signature Bank, Silicon Valley Bank, and First Republic bank, understanding the assets and liabilities that make up banks’ balance sheets can give insight in how they operate and why they sometimes fail.
Assets: The Building Blocks of Banks’ Business
Assets are the foundation of a bank’s operations, serving as a base to provide loans and credit while also generating income.
A healthy asset portfolio with a mix of loans along with long-dated and short-dated securities is essential for a bank’s financial stability, especially since assets not marked to market may have a lower value than expected if liquidated early.
ℹ️ Mark-to-market means current market prices are being used to value an asset or liability on a balance sheet. If securities are not marked to market, their value could be different once liquidated.
As of Q4 2022, U.S. banks generated an average interest income of 4.54% on all assets.
As of the end of 2022, Charles Schwab was the bank with the largest amount of assets marked as “held to maturity” relative to capital, leading to concerns that it may be close to insolvency.